Boost your productivity with new grid enhancements for Dynamics 365 and model-driven Power Apps.
These updates will help you navigate grids faster, customise views and gain insights, saving time and improving decision-making.
In this article, we summarise the latest enhancements and offer a demonstration video.
Column Customisation
Reordering Columns
- Drag-and-drop controls enable easy reordering on the column header.
- The column dropdown menu now includes ‘move left’ and ‘move right’ controls.
- These new methods offer a flexible alternative to the existing ‘edit columns’ option.
Width Adjustment
- This new feature allows precise column widths to be set using pixel values.
- Keyboard controls can also be used to adjust grid column widths, improving accessibility.
You can save these column customisations to update an existing view or to create new personalised views.
Improved Grid Navigation
Infinite Scrolling
- The new infinite scrolling feature offers an alternative to traditional grid pagination, allowing seamless browsing through rows.
- Enable infinite scrolling to continuously scroll through records without clicking to load additional pages.
Increased Record Selection
- With the arrival of infinite scrolling, you can also select up to as many as 1,000 rows at the same time, enabling bulk actions to be completed.
Data Organisation in Grids
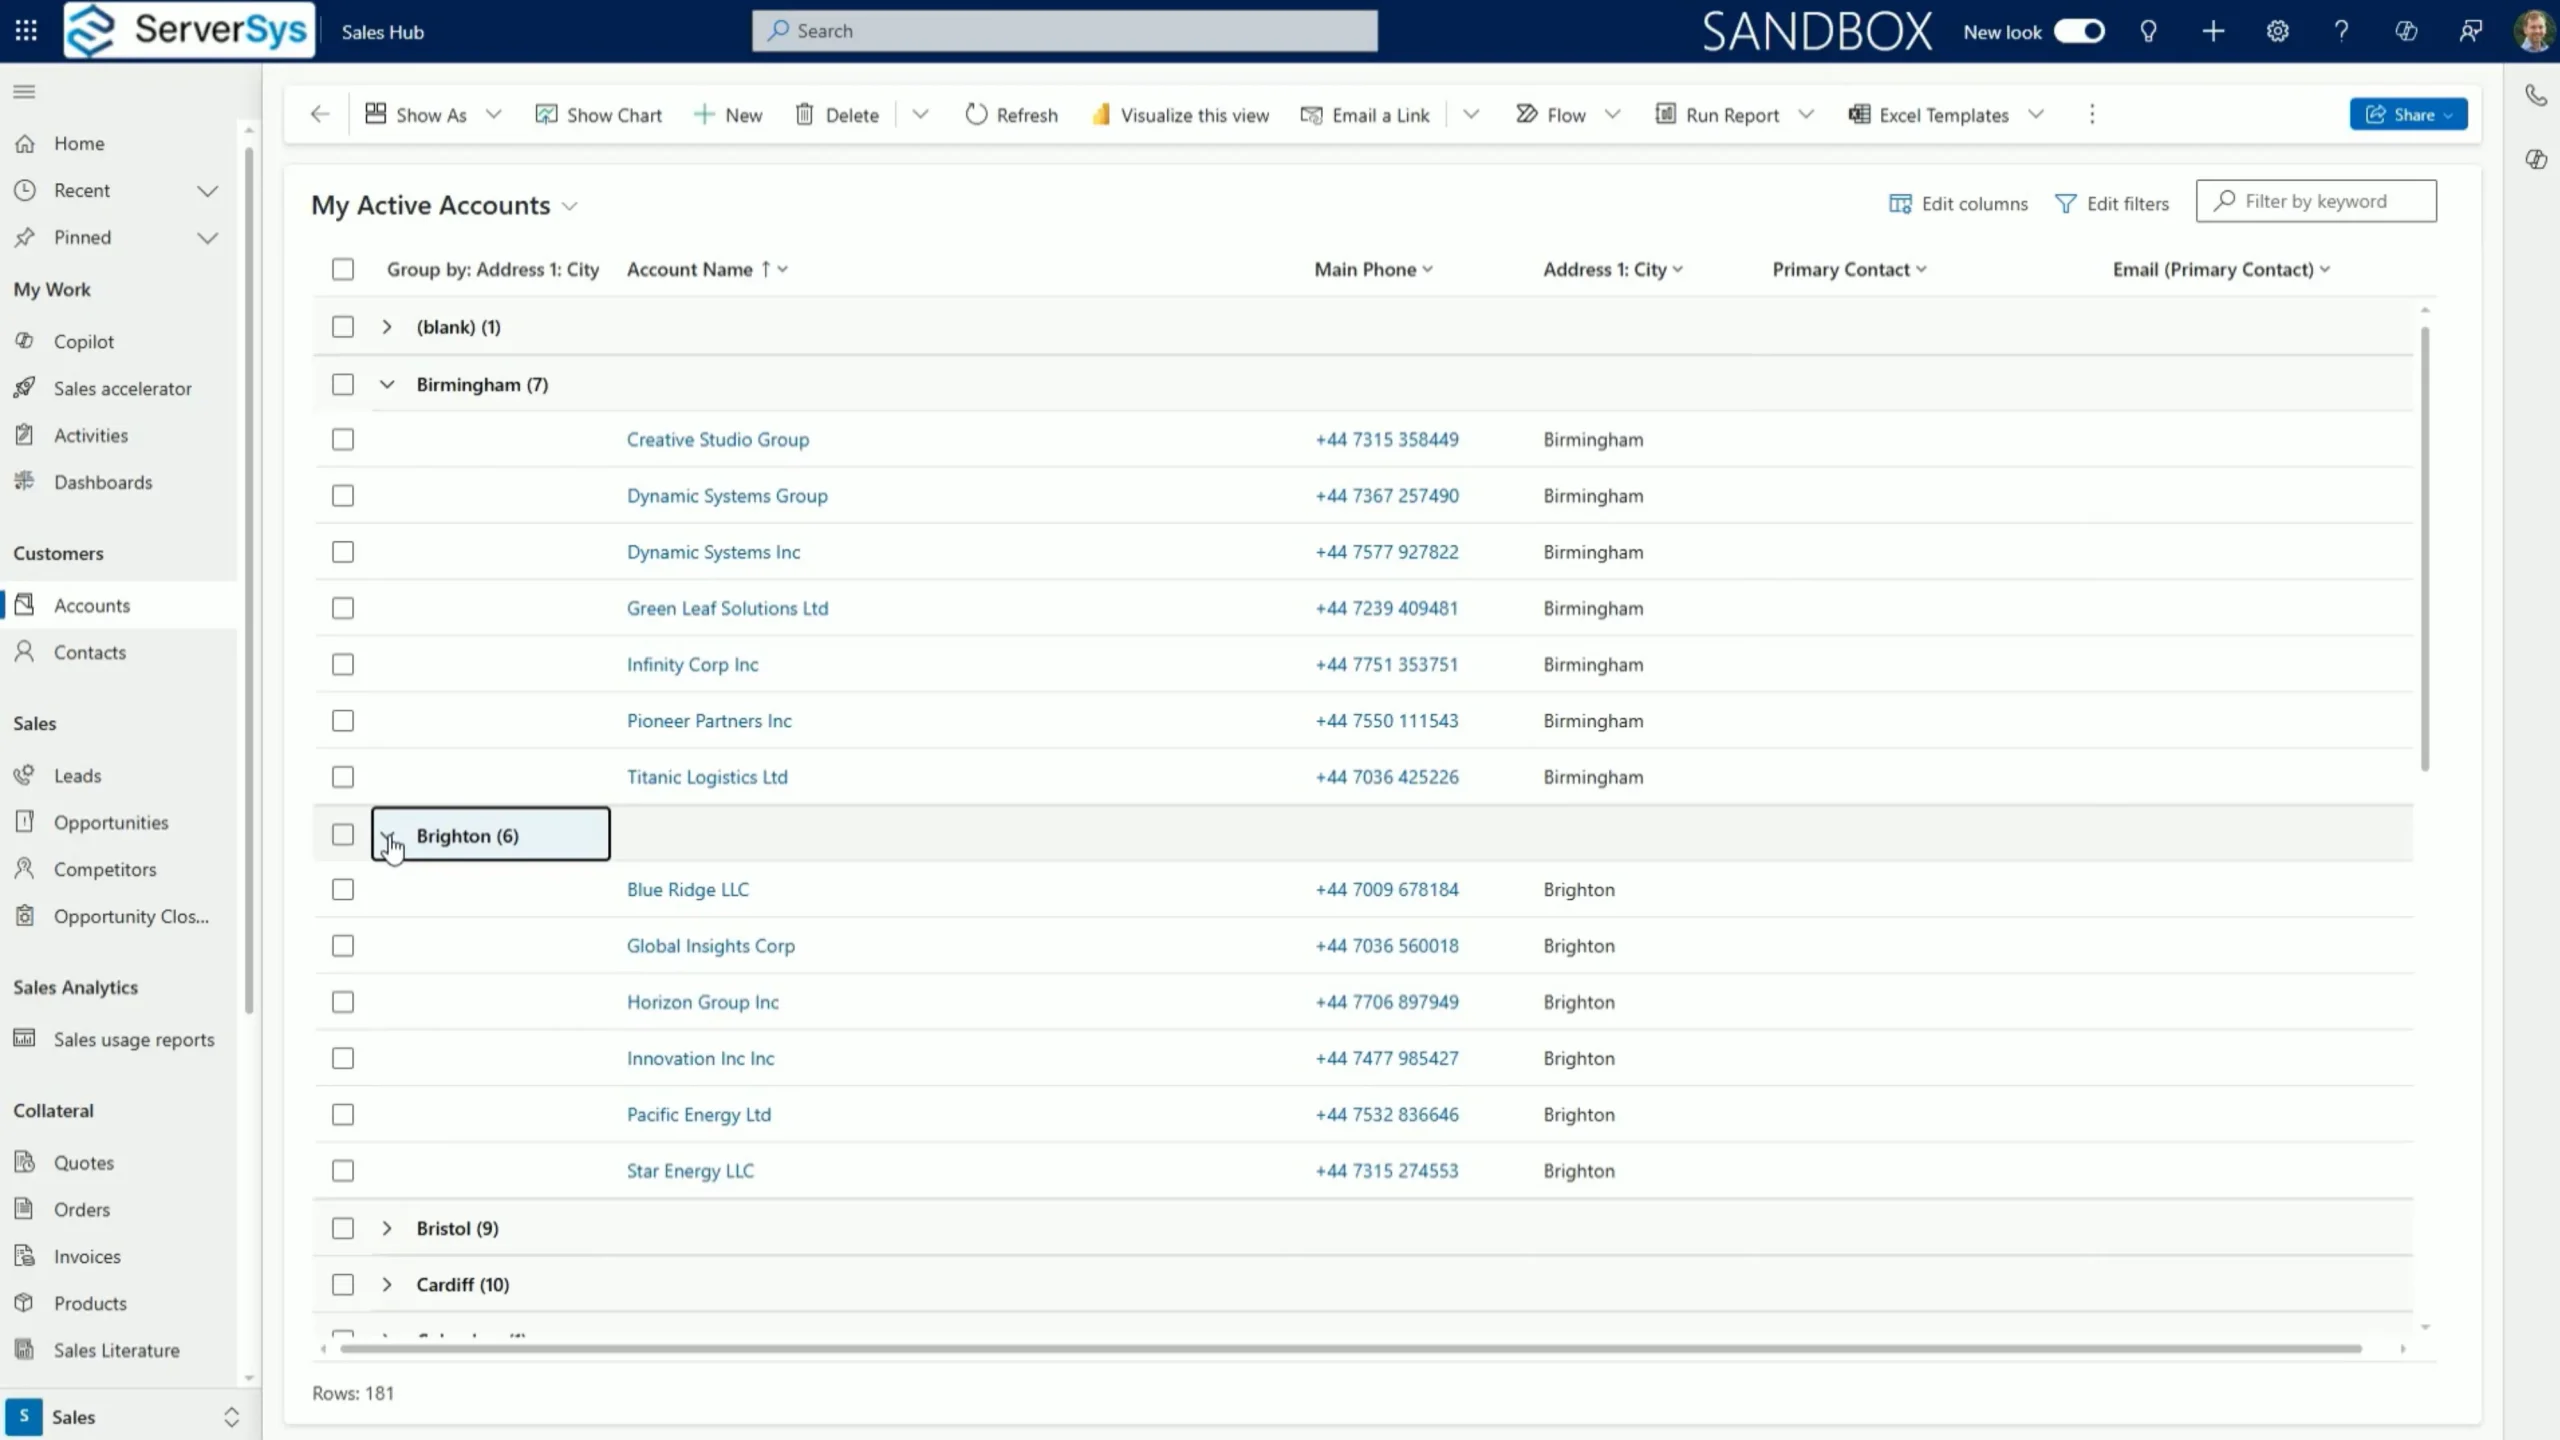
Grouping by Column
- Simplify navigation by using columns to group data in grid views. This helps boost productivity with quicker navigation through rows grouped in collapsible sections by column values.
- Column grouping works on most data types, with the main exception of lookup columns.
Aggregating Numerical Values
Gain instant insights by aggregating numerical data columns directly in your grids. Apply sum, average, or count controls that remove the need for manual calculations or separate reports.
Demonstrating New Dynamics 365 Grid Features
Video Transcript
In Dynamics 365 and model-driven apps, you can now easily reorder columns using drag-and-drop controls on column header.
This is just one example of a series of new grid features introduced in the 2024 Release Wave 2 to improve user navigation and help you act on your data.
Another approach is to use the new ‘move left’ and ‘move right’ controls from the column dropdown menu.
You can still use the ‘edit columns’ option, but these new controls offer more flexibility to make changes directly within the grid.
A further improvement is the ability to set a precise width for your grid columns.
Columns can still be resized using a mouse to expand or narrow the width, but this additional feature allows widths to be set using the exact pixels and can be applied using a keyboard.
Each of these column customisations can be saved to update an existing view or create a new personalised grid view.
Infinite scrolling is also available on read-only and editable grids to improve navigation and save time. Here, I can use infinite scrolling to move through rows of accounts without clicking through various pages.
You can also select more records. For example, with infinite scroll available within grids, it’s now possible to select up to as many as 1000 records and apply bulk actions to this selection using the command bar.
Another grid enhancement allows you to group data in your view by using a single column. In this example, we’ll group accounts by city.
This offers an alternative way to organise your view by expanding and collapsing groups using data from a selected column.
This includes flexibility to have as many groups expanded or collapsed simultaneously as needed.
Grouping works on most types of data when infinite scrolling is enabled, but this feature isn’t supported when classic grid paging is used.
One thing to highlight is that changes to grids made using these ‘group by’ controls don’t persist, so currently, these customisations can’t be saved as the default display or used to update or create a personalised and system views.
To switch back to the regular grid view, click the ungroup option in the relevant column.
You can also aggregate numerical values within a grid column.
In this example, we’re using the Dynamics 365 Sales Hub, but the same feature can be used in numerical columns for other Dynamics modules and model-driven Power Apps.
By selecting the ‘totals’ option in the dropdown menu of a numerical column, there are options for automatically showing the minimum, maximum, sum or average value of each row in the selected grid column.
For the estimated value of our open opportunities, we’ll select the option to show the total sum.
Multiple numerical columns can be aggregated simultaneously, so in the same view, we’ll adjust the view to display the average value of entries in the probability column. Any column rows that don’t include a value will be ignored in this calculation.
Again, these customisations don’t persist but can help sales and other teams interpret their data more quickly.
These are just some of the recent enhancements to model-driven apps in the latest release wave.
If you enjoyed this video please give it a like and subscribe to the ServerSys channel to receive our updates about Dynamics 365 and the Power Platform.
Related
- Power Apps Grid Control [Microsoft Resource]
- Customising Option Set Controls in Grids

