Do you find it challenging to keep on top of your automations as more workflows are run in Power Automate?
You’re not alone as the amount of this automation data can easily overwhelm administrators.
The new Automation Center in Power Automate was developed to meet this challenge. This hub simplifies and organises data to help you to track metrics, pinpoint issues, and act on automation insights.
Automation Center: Benefits Summary
- Enhance your oversight of Power Automate flows.
- Gain actionable automation insights in one place.
- Helps accelerate the resolution of automation-related issues.
- Streamlines workflow error tracking.
- Easily assess performance for desktop and cloud flows.
Key Capabilities
In Power Automate, the Automation Center provides various functions to manage and monitor the health of your automations in one place.
Monitoring and Insights
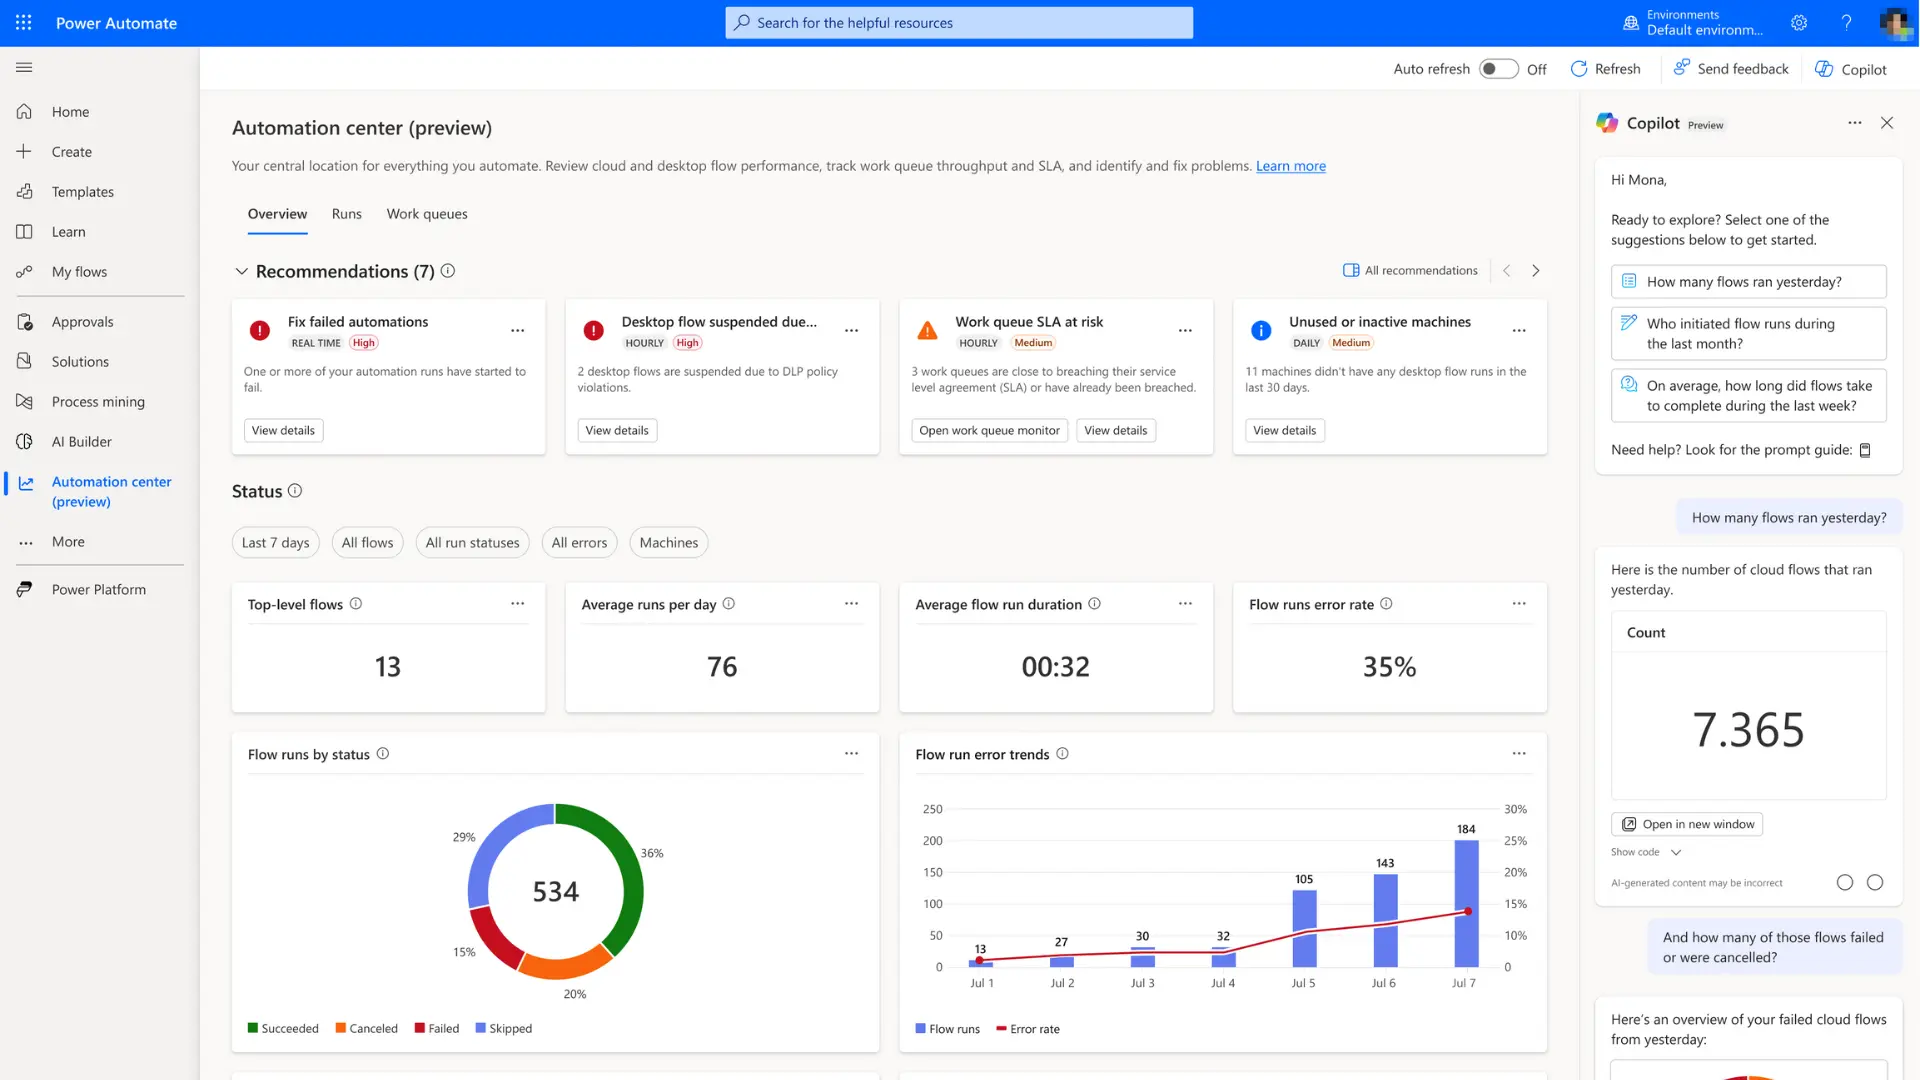
Within a unified view, you can see the performance of your flows and runs end-to-end, including child and desktop flows. The centralised hub allows you to oversee and manage automated processes from a single location for a cohesive approach to automation management.
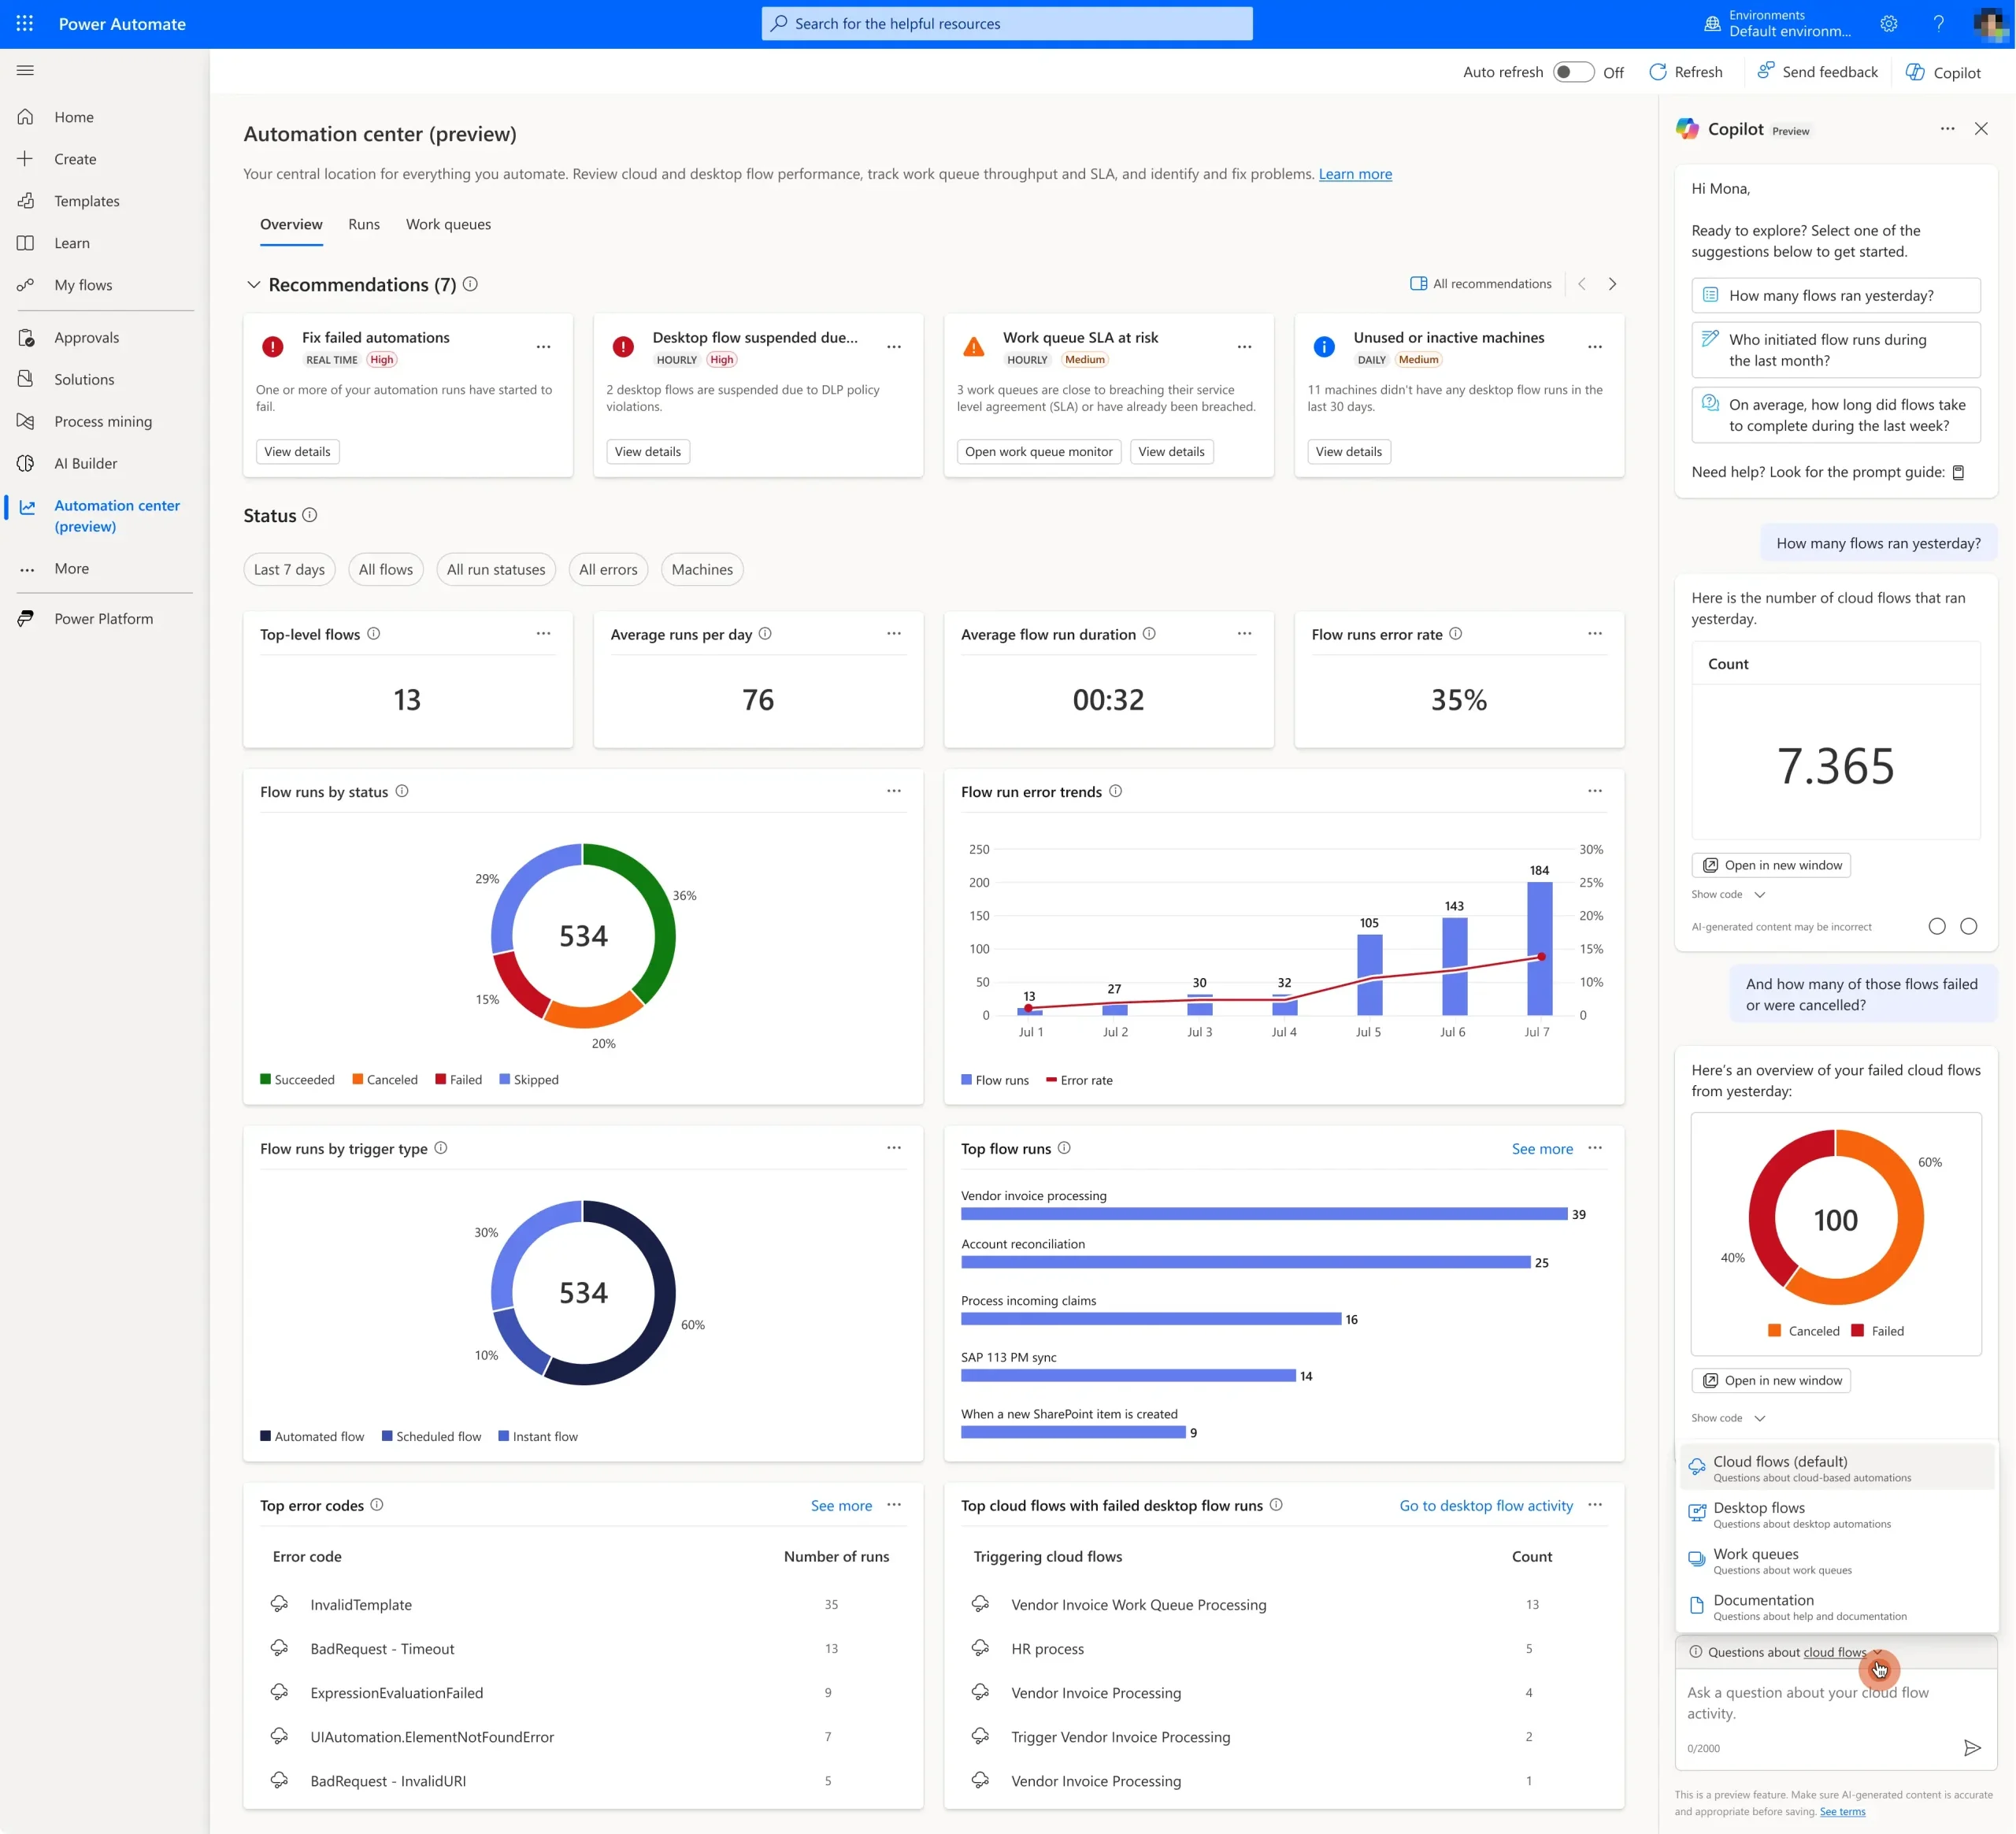
The Automation Center main dashboard (above) displays performance indicators and stats for cloud and desktop flows in your environment, making it easier to observe and react.
Trend Analysis and Error Identification
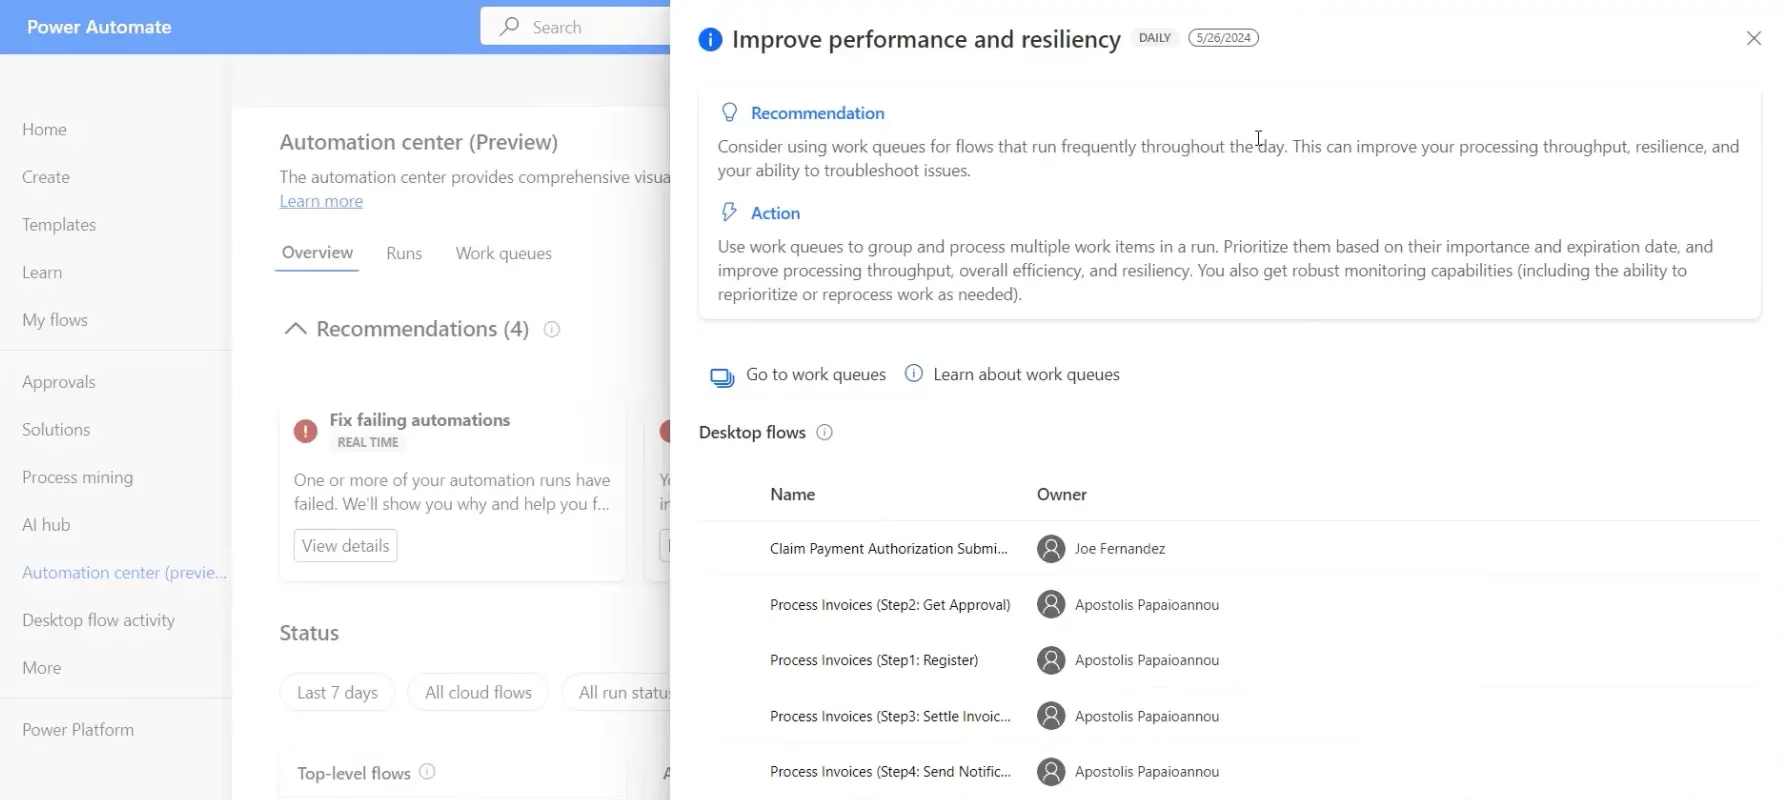
Trend analysis uses desktop flows and cloud flow run history to spot patterns and highlight performance suggestions. For instance, Automation Center recommendations may include adding resilience to specific flows using work queues.
Recommendation Cards
Recommendation cards are the starting point for detecting automation errors within your environment or finding opportunities for performance improvements. Examples of Power Automate errors and warnings that can be flagged include:
- Insufficient process capacity
- Failing automations
- Work queue SLAs at risk or in violation
- Desktop flows suspended due to data loss prevention policy violation
- Unused machines
These items are displayed in recommendation cards, featuring an impact assessment and allowing you to drill into more detail. A refresh frequency is also shown. Depending on the type of issue, recommendation data will be updated daily, hourly, or in real-time.
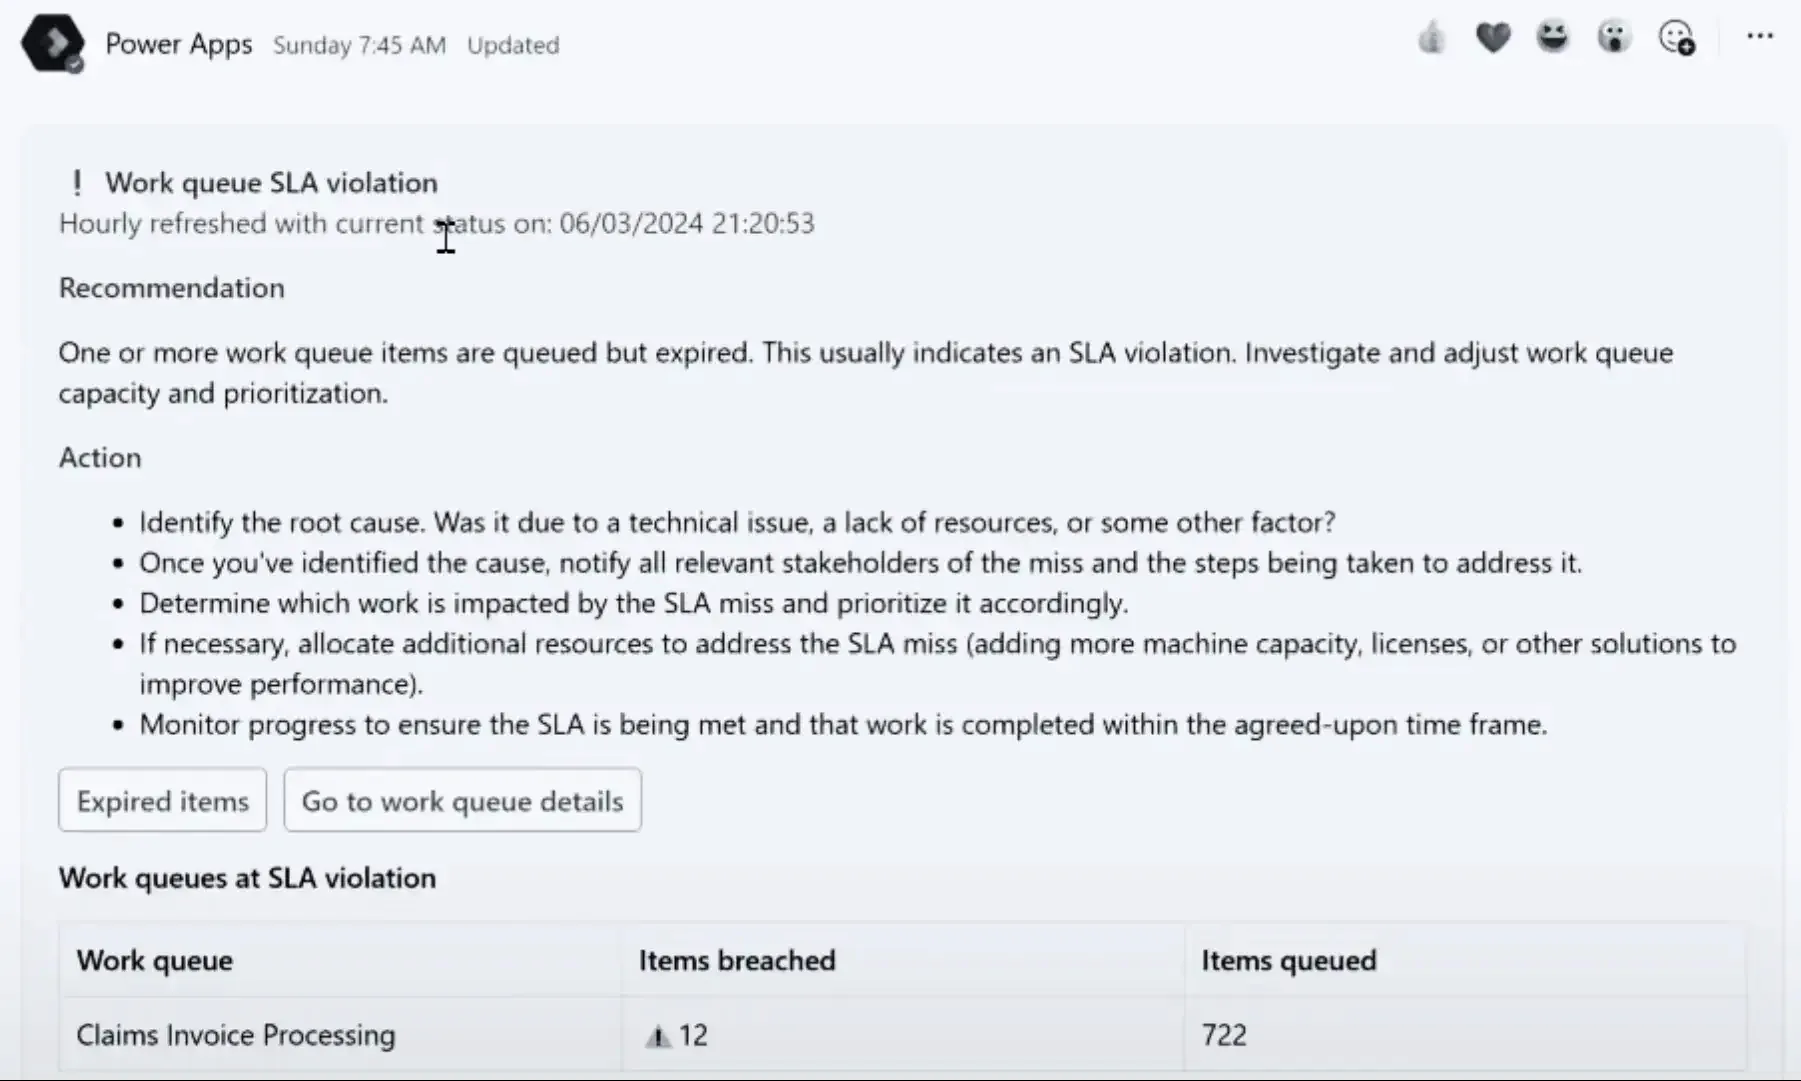
When automation errors arise, administrators can be alerted with these adaptive cards through Microsoft Teams.
Recommendation Panels
You can view an inline recommendation panel containing an expanded recommendation with action steps by clicking a card.
Overview Tab
Additional Power Automate insights, shown in the Overview tab, include:
The average number of flows run each day
Average run duration
Top flow runs
Flow runs error %
Daily flow run error trend
Flow runs by status
Top error codes
Options are available for filtering, allowing admins to slice and dice automation data as needed.
Work Queues Tab
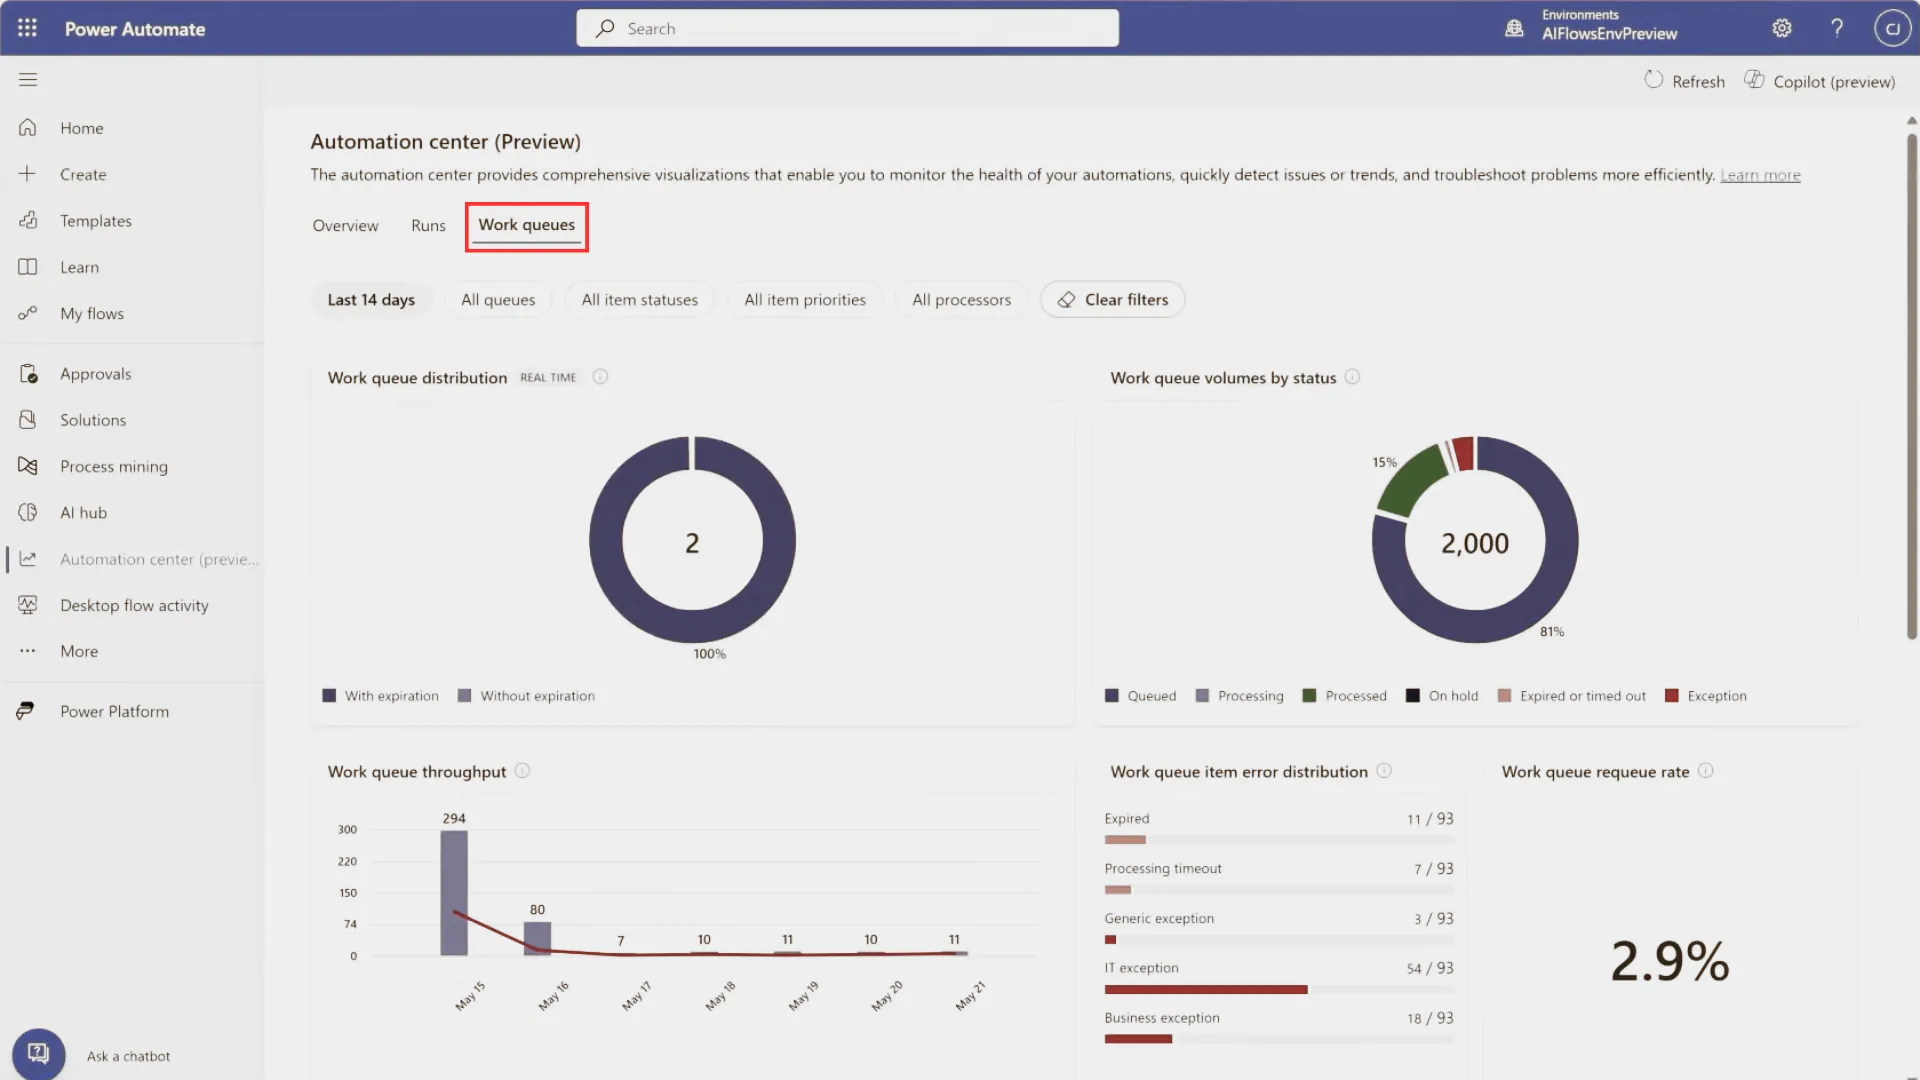
Within the Work Queues tab, you can track the health status of your automation queue items. This includes visibility into workload distribution, enhancing task monitoring and throughput analysis.
The prebuilt dashboard includes:
Work queue volumes by status
Work queue throughput
Work queue item error distribution
Requeue rate
Average handling time
Top work queues by error frequency
Runs Tab
The Runs tab combines and presents all flow executions. It captures information each time you trigger a flow (a ‘run’), including its status, outcomes, and any initiated child flows. This log gives you a top-level view to identify bottlenecks or errors across desktop and cloud flows.
Copilot in the Automation Center
An integrated Copilot in the Automation Hub delivers additional capabilities and insights about your automation activity. This includes:
Answering Queries: Ask questions about your flows in natural language, and Copilot provides answers using data from the Azure OpenAI service. You can ask questions covering:
- Cloud and desktop flow run logs
- Work queue data
- Power Automate ‘how to’ and other feature questions
Data Retrieval: Copilot fetches specific data in response to your questions. For instance, direct Copilot to create tables and charts with information organised according to your security settings. Data presented in the Automation Center is managed through Dataverse tables using role-based access controls.
Prerequisites
Accessing recommendations in the Automation Center requires a Power Automate Premium license and the Environment maker role.
Preview the Automation Center in Power Automate
Get started by testing the Automation Center to assess its capabilities.
We are hugely excited by this new feature and how it helps admins monitor the performance and health of their flows.
Don’t hesitate to contact ServerSys if you need assistance navigating the Automation Center or using Power Automate to modernise your processes.
